Form Analytics
Measure form performance and gauge how effectively you are converting inbound visitors.
Conversion rate tracking
To setup conversion rate tracking, simply include the following script tags somewhere outside of your form.
<script type="text/javascript">
  function configureAhoy() {
    ahoy.configure({
      visitsUrl: "https://usebasin.com/ahoy/visits",
      eventsUrl: "https://usebasin.com/ahoy/events",
      page: "1a2b3c4d5e6f" /* Use your form id here, this is just an example */
    });
    ahoy.trackView();
    ahoy.trackSubmits();
  }
</script>

<script src="https://cdn.jsdelivr.net/npm/ahoy.js@0.3.9/dist/ahoy.min.js" async defer onload="configureAhoy()" ></script>

<form>
...
</form>
Notice
Make sure you swap out 1a2b3c4d5e6f in the snippet above with your form's unique endpoint string. Otherwise, we won't know which form to track conversions on.
Form Analytics Dashboard
Once you have conversion rate tracking set up (using the script above), Basin provides a comprehensive analytics dashboard for each of your forms. The dashboard gives you insights into form performance and visitor behavior.
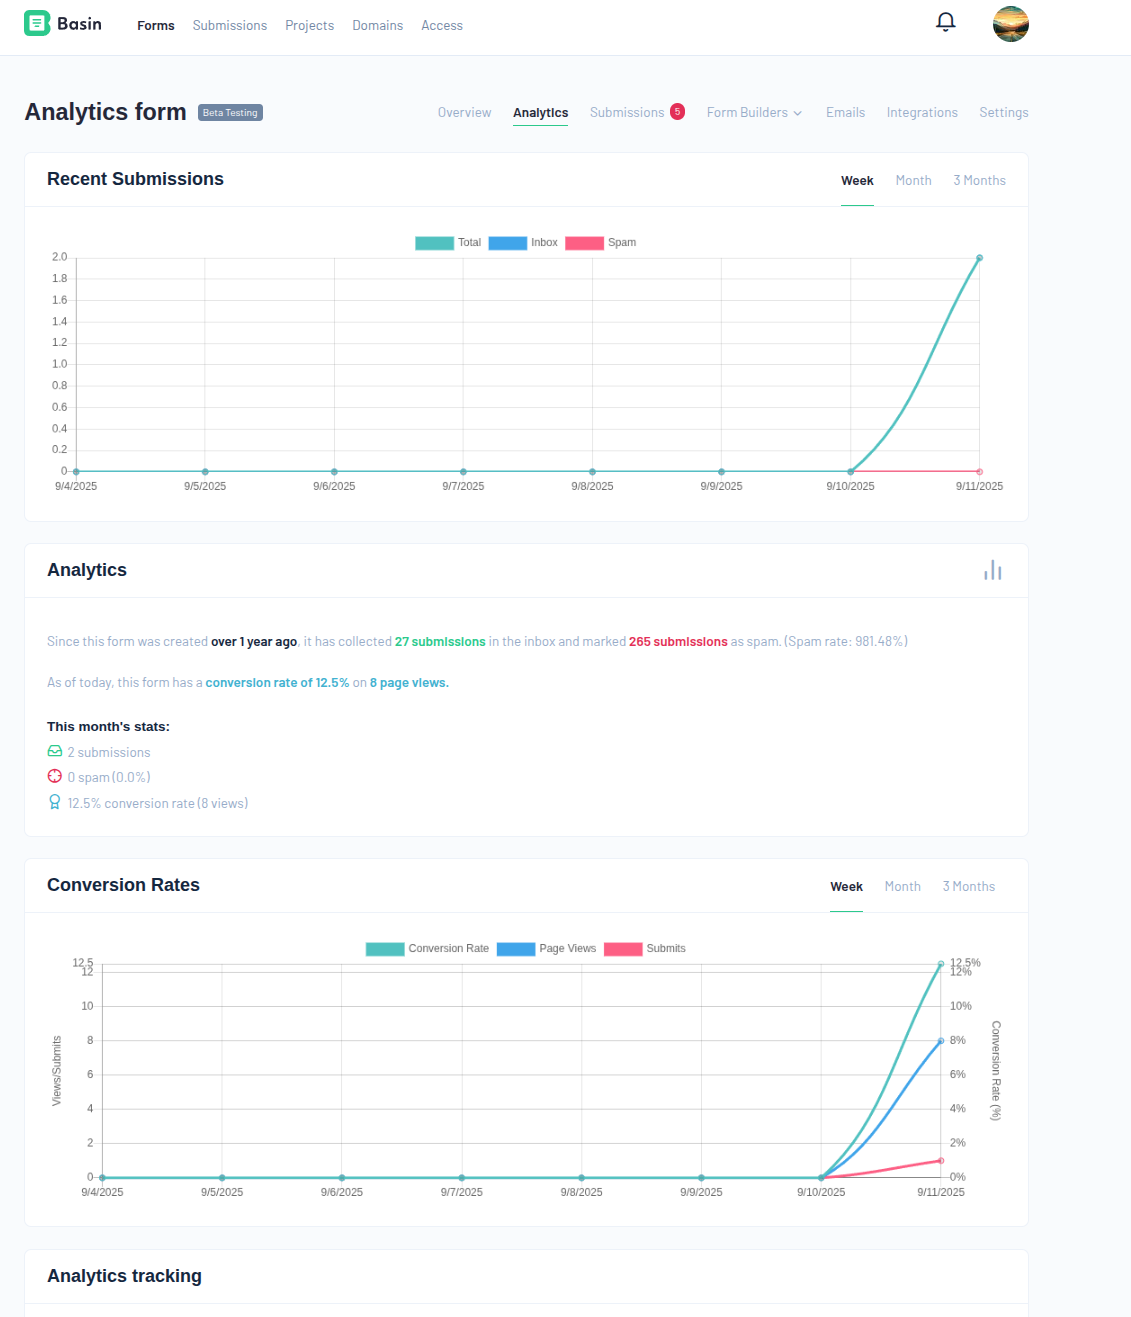
Dashboard Overview
The analytics dashboard displays:
Historical Performance - Total submissions received since form creation - Breakdown of submissions vs. spam submissions - Overall conversion rate and total page views
Current Month Statistics - Recent submission count - Spam rate percentage - Monthly conversion rate with page view data
Conversion Rate Chart - Interactive chart showing conversion rates over time - Multiple time period views: Week, Month, and 3 Months - Tracks three key metrics: - Conversion Rate (teal line) - percentage of visitors who submit your form - Page Views (blue line) - number of times your form page was viewed - Submits (red/pink line) - actual form submissions received
The dashboard automatically updates as new data comes in, giving you real-time insights into your form's performance. This data helps you understand visitor engagement and optimize your forms for better conversion rates.
Getting Started
To see analytics data, make sure you've implemented the conversion rate tracking script on your form pages. Without this script, the dashboard will only show submission counts without visitor and conversion data.
Multi-Step Form Analytics
For forms using Progressive Form Capture, Basin provides specialized analytics to help you understand how users interact with your multi-step forms.
Multi-Step Sessions & Completions Chart
This interactive chart tracks two key metrics over time:
- Sessions (blue line) - Total number of users who started your multi-step form (includes both completed and abandoned sessions)
- Completions (green line) - Number of users who successfully completed all steps of your form
The chart is available in three time ranges:
- Week - Last 7 days of activity
- Month - Last 30 days of activity
- 3 Months - Last 90 days of activity
Key Metrics Displayed: - Total sessions (completed + abandoned) - Total completions - Overall completion rate percentage
This data helps you identify trends in form abandonment and understand the effectiveness of your multi-step form design.
Multi-Step Funnel Chart
The funnel visualization shows the step-by-step progression through your multi-step form:
- Each step displays the number of users who reached that step
- The funnel width represents the proportion of users who continue to each subsequent step
- Identifies exactly where users abandon your form most frequently
- Final step shows completion count
The funnel chart helps you pinpoint problematic steps in your form where users commonly drop off, allowing you to optimize those specific sections for better completion rates.
Requirement
Multi-step analytics are only available for forms using Progressive Form Capture with BasinJS. The form must have the data-basin-multistep attribute configured.